Exploring the Features of Intelligent Monitoring, Powered by INAP INblue
What would you do if you didn’t have to spend time on routine server- or cloud-related maintenance and monitoring?
According to INAP’s The State of IT infrastructure Management report, a vast majority of IT professionals say they are not spending enough time designing or implementing new solutions, working on expansions or upgrades, or focusing on information security projects. As it stands, 25 percent of participants say they spend too many hours on monitoring, and it’s clear that there’s a desire to set aside the busywork for value-added projects, allowing IT to be a center for innovation, rather than viewed as “purely keeping the lights on” by the company’s senior management.
Intelligent Monitoring, powered by INAP INblue—a multicloud infrastructure management platform, gives you time for what matters. It’s a premium managed cloud and monitoring service—available today for INAP Bare Metal customers—that raises the bar for managed hosting solutions by ensuring proactive support, service transparency and consistent performance.
“Infrastructure monitoring strategies are only as good as the actions that follow alerts,” said Jennifer Curry, SVP of Global Cloud Services at INAP. “We built Intelligent Monitoring to not only improve cloud performance and availability, but to set a new benchmark for managed services transparency.”
In addition to an improved service experience, Managed Bare Metal customers also have access to the same enterprise-grade monitoring and management tools used by INAP technicians, offering functionality and control that will eliminate the need for customers to invest in third-party remote monitoring and management solutions, including remote execution and scripting, unified log management, patch management and automation, and port, service and URL monitoring.
Let’s take a closer look at the features that make Intelligent Monitoring a one-of-a-kind solution.
Advanced Monitoring & Action Items
Built from the ground up with leading technologies like SaltStack and Elastic Beats, the Intelligent Monitoring agent tracks everything from server resource usage to Apache and MySQL connections. The in-depth, proprietary monitoring technology is installed directly onto your server, enabling INAP technicians to respond to alerts before performance degrading issues arise. Default trigger thresholds are chosen by INAP’s support team based on years of data and first-hand expertise. You have full access to all monitoring metrics and can request custom alert triggers, or modifications to trigger thresholds.
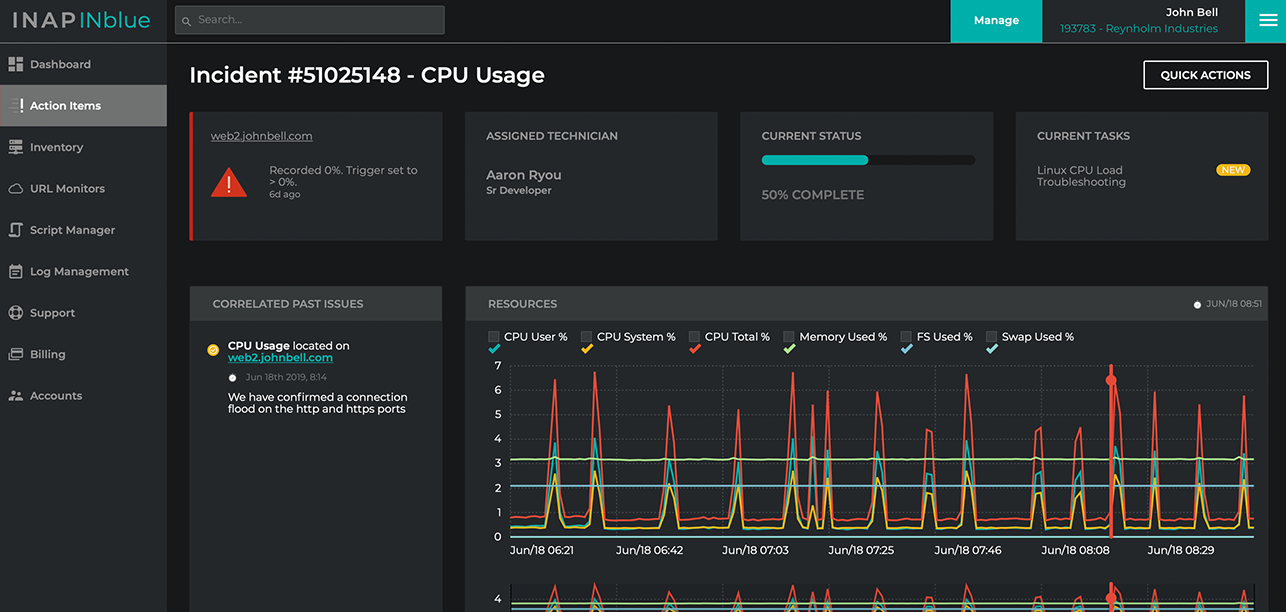
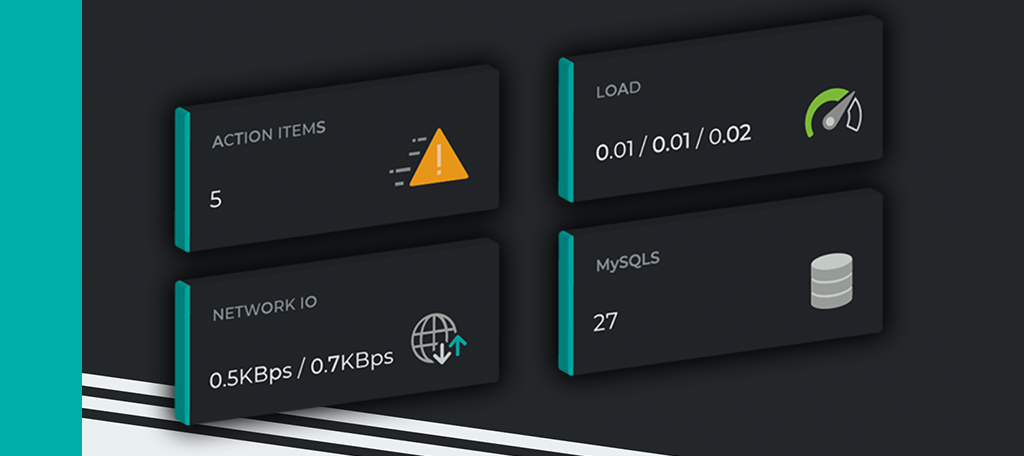
When you log into INblue, the dashboard will give you a snapshot of your server environment through system events called Action Items. If you subscribe to the fully managed Service First edition, these items allow your INAP support team to proactively manage your environment and rapidly respond to alerts. Action Items are triggered in a variety of ways, including when infrastructure or network monitoring thresholds are surpassed, when a critical service shuts down or when a new software patch becomes available.
Support Remediation Aided by Smart Workflow System
INAP technicians remediate Action Items using our proprietary Smart Workflow System, which enables fast, accurate and consistent troubleshooting. Here’s a brief look how it works:
- The Smart Workflow System defines the Action Item type and initiates appropriate workflow process.
- The system automatically creates a support case for the Action Item, pulling historical correlated issue data, trigger metrics and detailed log info.
- Using the data and Action Item type, the assigned INAP Service First support technician investigates the issue following a branching series of software-defined and expert-tested remediation steps. Customers may request custom workflows for scenarios unique to their environment.
- Upon resolution of the Action Item, your assigned technician will notify you via the Action Item details page and include relevant root cause data.
- The Smart Workflow System constantly improves as new system data and insights from INAP experts modify issue definitions and remediation steps.
On the other side of the glass, the INblue platform is your vehicle for ensuring absolute transparency. At the top of any Action Item details page, you’ll see the INAP technician assigned to the workflow, the current status of the event and tasks they are currently performing or have already performed. You can review information about correlated past issues, metric and log data pinpointing a trigger, and your full support history for any Action Item.
However, for most Action Items, you won’t have to do a single thing. Intelligent Monitoring’s Smart Workflow System and the INAP Service First support team are on top of every case.
Patching and Log Management
Intelligent Monitoring radically simplifies two activities that most IT professionals consider especially tedious: patching and log management.
The patching update process is streamlined, as all available patches for your server are proactively listed in groups. You can handle this process in one of two ways, depending on how much control you want. You can confirm and schedule the patch to complete the process with INAP support, or—if you want a hands-off approach—you can choose to auto-patch your server daily and your team will receive calendar invites for each scheduled patch.
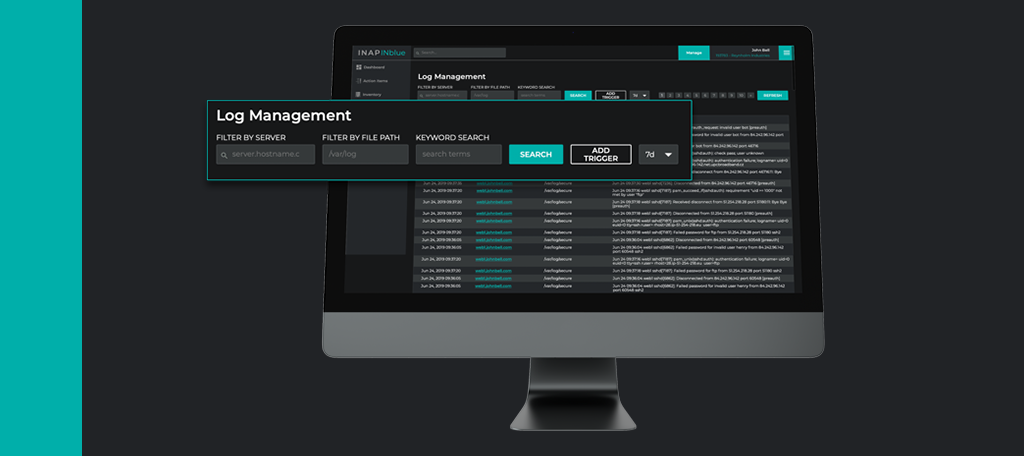
Intelligent Monitoring will also save you from manually browsing events by providing a chronological event log for all your servers. Easily filter by server and file path, or dive deep with a keyword search. You’ll be able to accelerate analysis and locate critical information. Plus, the log management feature provides your INAP technicians critical, actionable intelligence to keep your environment compliant and secure.
Remote Execution and Scripting
Intelligent Monitoring allows you to easily create and run remote execution scripts to any of your installed servers, giving you a single portal for taking control of your environment. You can choose from scripts you’ve already created and schedule them by inserting a token from your two-factor authentication application. You will automatically receive an email when the script successfully executes.
If you want to create your own Bash or Powershell scripts, you can do so via the Script Editor, located in the side navigation of the INblue platform.
Port, Service and URL Monitoring
Under the Ports tab on any Server Details page, you can review, edit and monitor triggers for your server’s open and closed ports. Port Status changes will be shown in your Action Items list.
Intelligent Monitoring also allows you to monitor any available services running on your system. You can also stop, start or restart services from the Services tab. For example, you can enable service monitoring on Chron Dee, enabling the auto-restart feature. With this monitoring feature enabled, you can rest assured that if a service ever fails, it will automatically create a new Action Item.
Looking Ahead
This is just the beginning for Intelligent Monitoring, powered by the INAP INblue platform. Many more features and capabilities are on the way, but in the meantime, we hope you enjoy exploring the tool and look forward to hearing your feedback.